Esa Lappi, Dr.(mil. sci.), Senior Researcher, Arctic Natural Resources and Economy, Lapland University of Applied Sciences
Maria Tikanmäki, PhD, Leading Researcher, Arctic Natural Resources and Economy, Lapland University of Applied Sciences
Keywords: power outage; energy resilience; detached house; thermal resilience; heating systems; simulation; cold climate; backup heating
Introduction
Modern societies have become very dependent on access to large amounts of energy, which highlights the importance of energy system resilience. Here, the term resilience can be defined as the ability to survive and quickly recover from extreme and unexpected disruptions (Jasiūnas et al., 2021) such as severe storms or deliberate malicious actions that may cause extended power outages. For a typical homeowner, this creates a risk of the building cooling down during prolonged cold weather. Temperatures may first become too cold for normal life and ultimately lead to health risks and freezing of the water distribution system and consequently significant property damage. Indoor air temperatures decreasing below around 18 ⁰C are considered unsafe for vulnerable people and temperatures decreasing below around 4-5 ⁰C are causing severe cold stress for healthy people (Ayyagari et al., 2020, Sheng et al., 2023). During summer, prolonged outages may also result in thawing of frozen food.
Heating system resilience in residential buildings is especially important in the Arctic and cold-climate areas, where harsh environmental conditions and high heating demands increase vulnerability to energy supply disruptions. Energy resilience of residential buildings has been studied in Arctic or cold regions, for example, by considering the utilization of photovoltaic systems and batteries (Rehman et al., 2025) or bidirectional electric vehicle charging (Einolander et al., 2024).
Pulkkinen and Ramesh (2026) studied the impact of prolonged power outage during cold winter conditions on the thermal resilience of Finnish residential buildings using EnergyPlus simulations. They considered passive resilience solutions such as building envelope renovations. Their results showed that auxiliary systems are needed to avoid too low indoor temperatures.
In this paper, we show that a simpler computational model can be used to evaluate the resilience of different heating systems of residential buildings when energy consumption data is available. This paper examines a wintertime power outage scenario for a detached house and presents a simplified computational approach for simulation studies following NATO STO report (NATO Science and Technology Organization, 2014). The report gives clear instructions on how to conduct a simulation study.
The cooling of a building with and without auxiliary heating systems is studied using elementary physics. The aim of the study is to show how a simple calculation model can be utilized to estimate functioning and cost-effectiveness of different heating and energy solutions to improve energy resilience of a detached house. The model assesses how long it takes before cooling begins to cause severe temperatures inside the building.
First, we present the analyzed case study in the Arctic area. Then we present the computational method and the results. At the end, the implications to heating resilience are discussed and concluded.
Residential building cooling problem
Overview of the case study
The case study is based on data from a 110 m2 detached house in Muonio, coordinates 68°01’23.9″N 23°30’09.2″E built in 1946. The house has a hydronic central heating system with a boiler that can be heated either by electricity and/or wood, and two other wood-burning heaters. One of the wood-burning heaters is in the sauna and the other one in the living room. The downside of the wood-fired boiler (shown in Figure 1) is that it needs electricity to operate the pumps and, thus, does not operate during a power outage without additional investments in energy resiliency.
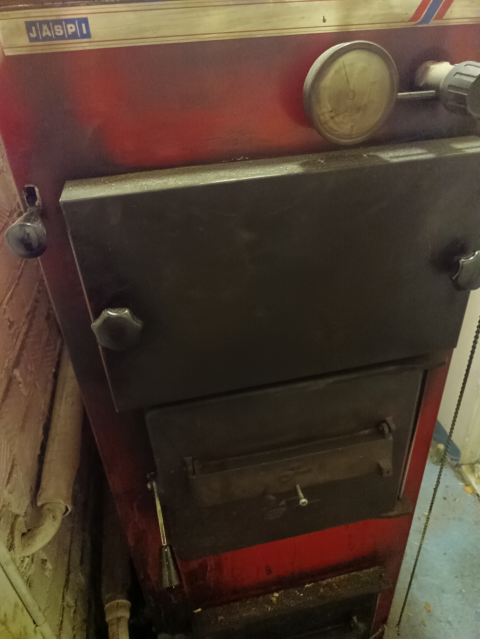
Figure 1. Jäspi hydronic wood boiler (20-40kW) needs a water pump (10-25W) for the heat transfer.
In the following, the possible failure mechanisms of the heating system due to a power outage are presented. Then, the heat transfer coefficient of the building is calculated based on the actual measured outdoor temperature and energy consumption data. After that, the heat transfer equations and the simulation model are presented.
Failure Mechanism
Table 1 presents different heating systems and the impact of a power outage on the house heating capability without any backup arrangements. Even systems using wood or oil as a main source of energy can lose their heating capability during power outages.
Table 1 Typical failure mechanisms of residential heating systems during a grid power outage.
| Heating System | Typical Failure Mechanism |
| Direct electric heating | Complete loss of heating capability. |
| Hydronic central heating with electric heat source | Loss of heating energy supply and shutdown of circulation pumps. |
| Hydronic central heating with oil- or wood-fired boiler | Burner control system shutdown and loss of circulation pump operation. |
| Masonry heater or wood-burning stove | Can remain operational, although use may be hindered by darkness; heat distribution and heating capacity may limit whole-building protection. |
Heat transfer coefficient
The first phase of computational studies is to understand the problem, namely the cooling of a building during a prolonged power outage. The most important factor is the heat loss from the building and available heat sources.
In the second phase, the required model parameters are estimated. Heat loss is affected by the outdoor and indoor temperatures, the thermal transmittance of the building envelope, and ventilation. A detailed analysis would require the calculation of the surface areas and heat transfer coefficients of all building components, as well as the heat removed through ventilation. According to the Ministry of the Environment (2017), the energy performance of buildings should be calculated using this type of approach for Energy Performance Certificates.
In this study, however, a simpler computational model is used, in which all of these factors are represented by an overall heat loss coefficient using existing data. This value can be estimated by dividing the total heating energy consumption by the operating time and the average temperature difference between indoors and outdoors. If the Energy Performance Certificate exists, an approximate value for the overall heat transfer coefficient can be obtained from it.
The heat flux leaving the building dQout/dt can be calculated using approximate formula
where u is overall heat transfer coefficient and Tin indoor temperature and Tout outdoor temperature.
To calculate reasonable by Eq. (1), energy consumption and outdoor temperature data from days that meet the following criteria are used:
- No wide outdoor temperature fluctuations to avoid time dependence of the heat transfer.
- Only electrical heating has been used, ie. no wood burned nor heat from inhabitants.
Table 2 presents data from the selected dates that meet the criteria. It includes the average outdoor temperature from nearby weather station Oustajärvi, estimated indoor temperature, temperature difference (indoor – outdoor), average heating power (kW) and heat consumption (kWh/day). The outdoor temperature data is obtained through “Lumme Energia” presenting the best available estimates of the average outdoor temperature. The estimated average indoor temperature was 20oC with mild outdoor temperatures, but 19oC was used with the outdoor temperature of -28oC, and 18oC with -35oC. The indoor temperature has been estimated by the inhabitants. Heat flux (kW) was calculated using daily energy consumption (kWh) divided by 24 hours.
Table 2. The input data points from Lumme energy that are used to calculate the overall heat transfer coefficient for the studied detached house. Original data yellow.
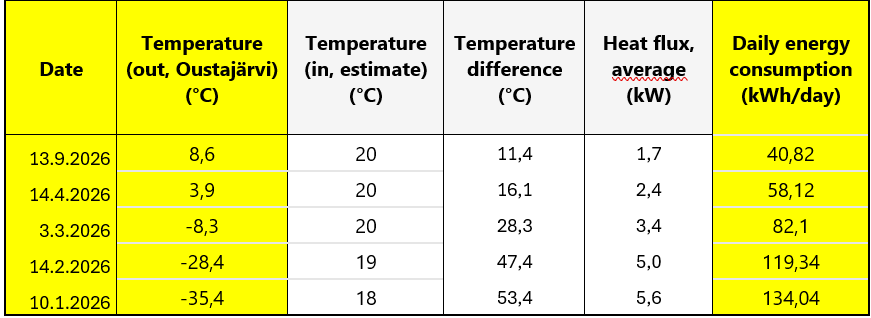
A regression fit of the temperature difference and energy consumption was made to estimate the heat transfer coefficient and the result is presented in Figure 2. The slope gives a heat transfer coefficient of 88,3 W/K. Ventilation vents of the building were closed during all the datapoints presented in Table 2, but a value of 90 W/K can be taken as a reasonably good estimate for the base case scenario.
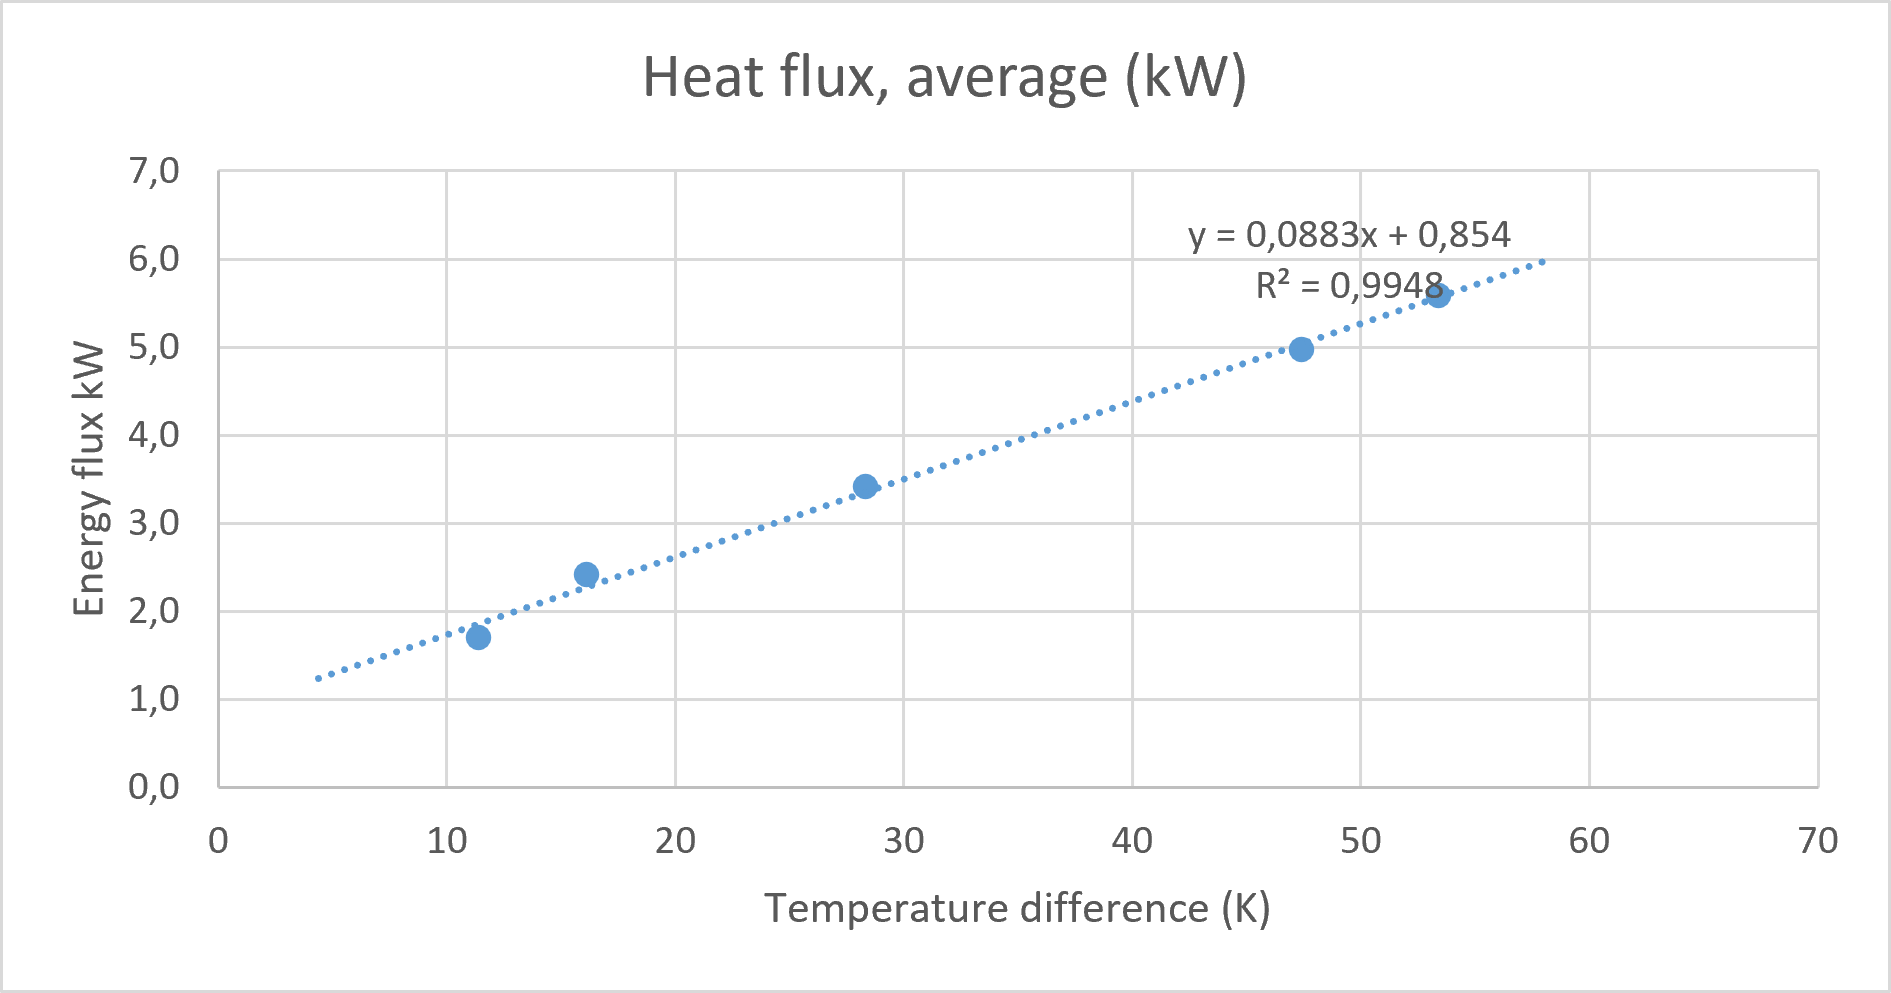
Figure 2. A regression fit of the temperature difference and energy consumption. The slope gives the heat transfer coefficient for a detached house in Muonio.
Heat transfer equations
In the following, the heat transfer in the detached house is presented by more detailed equations. In the simplified model, there are two heat storages: the building structures including the air inside the building with temperature Tin and the water inside the heating system with temperature Twater. The outside temperature is Tout. The heat transfer coefficient from water to air is uwb.
We end up with heat flux dQwb/dt between energy storage and indoor area:
- dQwb/dt = uwb ∙ (TW – Tin)
If there are additional heat sources, they produce energy with power P. The overall energy (heat) balance of the building is
(3) dQtotal/dt = – dQout/dt + P + dQwb/dt
Now we have a simplified model of the heating and cooling powers of the building.
Temperature as function of time
The temperature differences can be calculated using formulas
- ∆Qtotal = C ∆Tin,
- ∆Qwater = Cwater ∆Twater
where ∆Q is the heating energy, C is the heat capacity of the building and Cwater for water and ∆T is the temperature change after absorbing the energy ∆Q.
When we divide the value by time change ∆t, and let ∆t → 0, we get heat consumption (kW):
- dQtotal/dt = C ∙ dTin/dt
- dQwater/dt = Cwater ∙ dTwater/dt
The formulas (1)-(5) combined with (6)-(7) for water storage give system of differential equations:
- C ∙ dTin/dt = P + uwb ∙ (TW – Tin) – u ∙ (Tin – Tout)
- Cwater ∙ dwater/dt = – uwb ∙ (TW – Tin)
These equations are used in the simulation model. They can be solved analytically in simple cases. The values C and uwb were estimated using the actual cooling of the building during cold winter days.
Simulation model
In the model, heat transfer from the heating water to the indoor air is regulated by a thermostat, which limits the heat output when the indoor temperature approaches the target temperature. When different heating options are considered including thermostatic radiator valves and changes of temperatures in time, analytical solution becomes complex with step functions needed for heating systems and min/max functions for thermostatic valves. Thus, numerical simulation is useful in these more complex cases.
The simulation model was created using Octave software and written as .m -file. The simulation model uses the Runge-Kutta method with one-hour timestep for solving the temperature after power outage in different situations.
One simple test to validate the implementation of the model is to compare the analytical result and the simulated result. In this case, both give about 59 hours for the indoor temperature of the building to cool from +21oC to 0oC when the outdoor temperature of -35oC is assumed.
Results
The heat transfer coefficient is based on an actual house, but from now on, only simulated results are used to show the effect of different heating systems. First, the normal operation of the heating system without a power outage is simulated. Then, a worst-case scenario with a power outage during a cold spell is presented. There, the 5-days average outdoor temperature is taken as -35 oC. The parameter studied is the cooling of the indoor air temperature during the power outage. The operation of the heating system is simulated first without any redundant or auxiliary systems. Then, a battery to run the water pumps is added. Finally, results for an additional non-heat-storing stove are presented.
Base case and use of back-up energy for water pumps
The case-study building uses night-time electricity, so the water in the boiler (1.2 m3) is heated during nighttime and it will cool during daytime. The normal action of the simulated system without power outage in these conditions is shown in Figure 3. In Figure 4, the same is shown during a power outage showing cooling of the building without any redundant systems for heating.
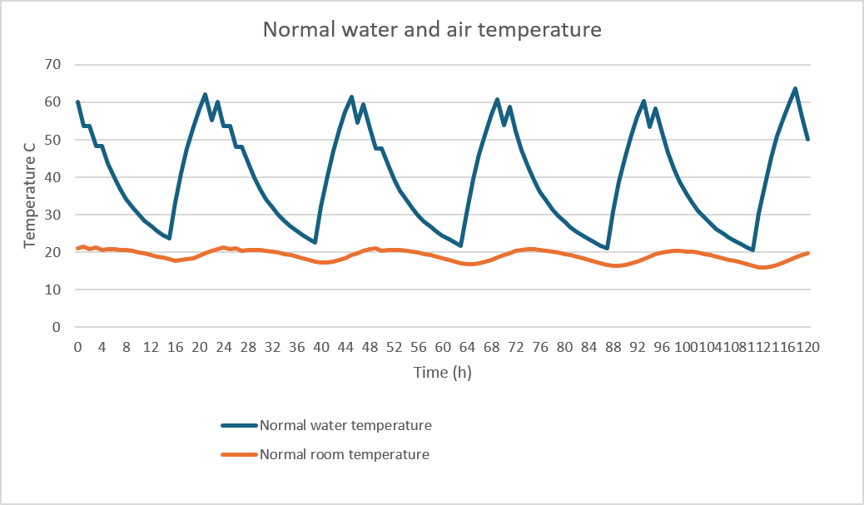
Figure 3. The temperature (oC) of water in the heating system (in blue) and the indoor temperature (in orange) of the house without power outage. The simulation is carried out with an outdoor temperature of -35 oC.
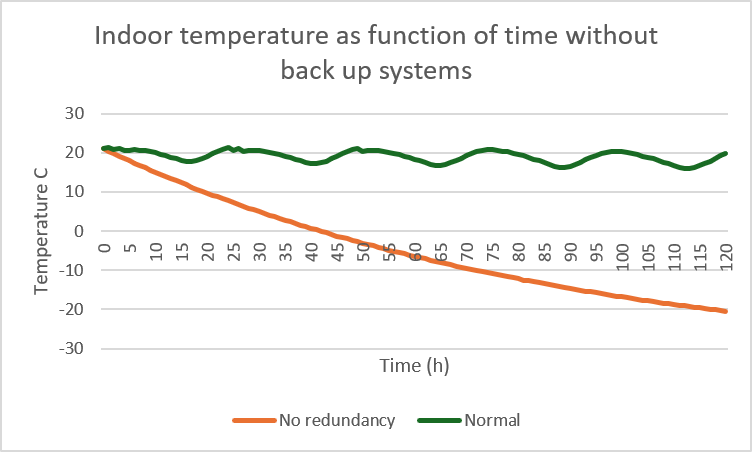
Figure 4. The indoor temperature (oC) as a function of time (h) during a power outage without any redundant systems (in orange) and without power outage (in green) for 5 days (120 hours). The power outage starts with hour 0 and stops all electric systems. The simulation is carried out with an outdoor temperature of -35 oC.
Next, a more resilient system where a battery enables operation of the circulation pumps for heating water is simulated. The result of this case is shown in Figure 5 in green. When comparing the results during a power outage during a cold spell, the battery enabling the circulation of hot water in the heating system delays the cooling of the building for almost a day compared to the situation without any redundant systems for heating.
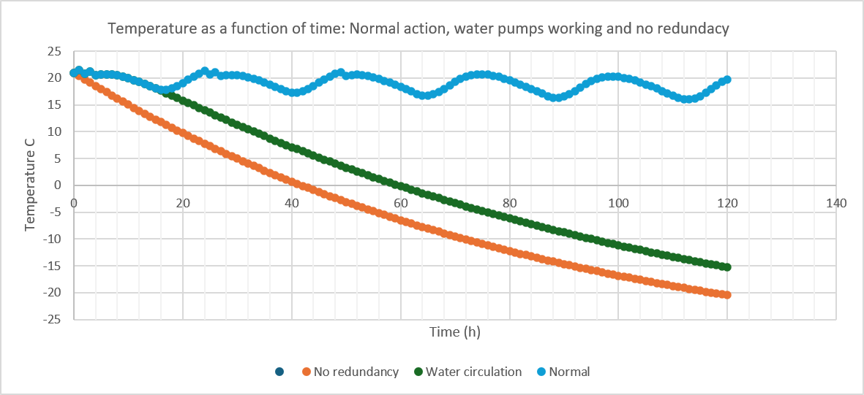
Figure 5. The room temperature (oC) as a function of time (h) during a power outage with battery-operated water pumps without using wood (in green), and previous cases as in Figure 4. The simulation is carried out with an outdoor temperature of -35 oC.
The resiliency of the system is improved even more if a wood-fired boiler is used. In this case, electricity is needed only for the water pumps to keep the heating system operational by providing energy to the water pumps of the wood-heated boiler and circulation of the heated water. There is no need to simulate these options with a wood burning option, because if the pumps work and there is wood, the power outage is not preventing the heating. This is limited by the battery size and ability to load the battery when needed. If a 25 W water pump is assumed, a 600 Wh battery will give additional 24 h operating time. If a gasoline generator (for example, 1kW-3kW) is used only to operate the water pump, the problem is low electric power consumption (20-50W) leading to wasted fuel as the generator is running practically at idle. If both the battery and the generator exist, the generator can load the battery. As an example, a Biltema generator has 15-liter fuel tank and 6-hour working time with 1-2 kW power. The battery can be loaded 12 times with ½ hour loading time. This gives about two weeks’ operating time for the heating system with one full fuel tank.
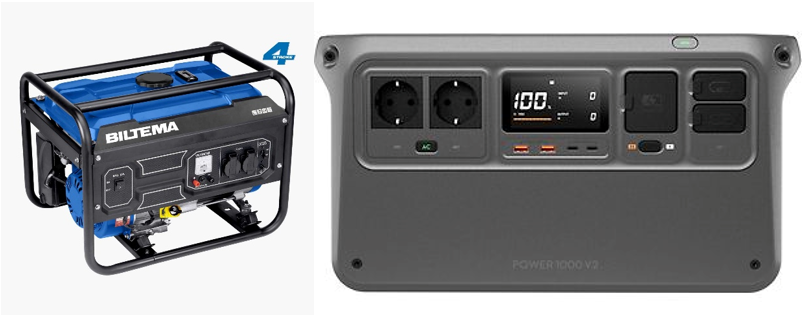
Figure 6. Example of generator Biltema G3000 (329€) and 1024 Wh Power Station DJI Power 1000 V2 (Verkkokauppa.com 669€), references: Biltema and verkkokauppa.com 11 October 12, 2026
Stove as a backup heating system
Next, results for heating with a Kota stove (6,5kW) are shown. The heat production was simulated with 4-hour, 8-hour, and 16-hour burning times per day. The temperature curves are shown in Figure 7. One stove gives enough power for heating the entire building when it is burned 16 hours a day as the simplified simulation model assumes universal temperature for the whole building. In real life, there would be a huge temperature gradient inside the building. This could lead to the living room with the stove becoming inconveniently warm. On the other hand, water systems far from the living room could get too cold during a longer power outage.
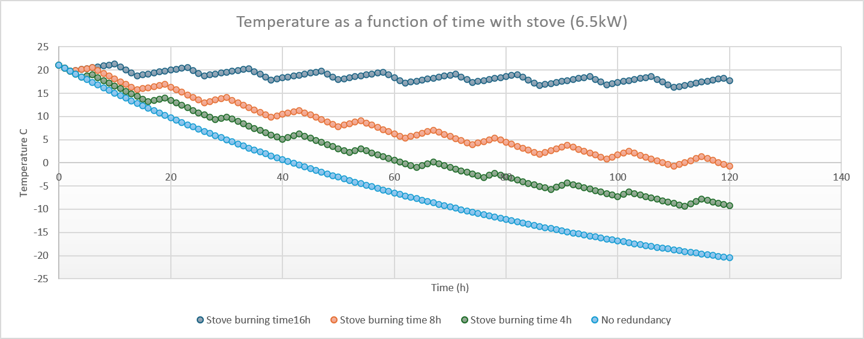
Figure 7. The average room temperatures (oC) as a function of time (h) during the power outage using a wood-burning stove as the redundant system. The stove is heated 4-hour (green), 8-hour (orange), and 16-hour (dark blue) per day. The cooling of the building without any redundant systems is also shown (light blue). With 16-hour daily burning time, enough heat is produced to keep the indoor temperature above 17 oC during a power outage when outdoor temperature is on average -35oC.
Summary of the results
The simulation results are combined in Table 3. The data represents time in hours in each simulation before the indoor air temperature reaches 15, 10, 5 and 0 oC during a power outage with -35 oC outdoor temperature. This average outdoor temperature is not unusual in Muonio.
No redundancy refers to a case where the heating system does not have any back-up system (Figure 4). In that case, the indoor air temperature reaches 0 oC in 42 hours. If water circulation pumps are working with batteries, the indoor air temperature of 0 oC is reached in 60 hours. If a non-heat-storing stove is used 4 or 8 hours a day, the indoor air temperature of 0 oC is reached in 62 or 109 hours.
If functioning of the water circulation is ensured by a battery, a wood-fired boiler can be used for heating the water as long as the battery or the portable power station has energy. This time is 24 hours with a 600Wh battery. If the battery is recharged using a gasoline generator, the indoor temperature remains over 15 oC during the 5 days simulation time. A similar result is achieved, if the stove is heated 16 hours a day.
Table 3. Time (h) after power outage started and the respective indoor temperature (oC) in different simulations.
| Temperature limit oC | 15 | 10 | 5 | 0 |
| Simulated case | Time (h), when the temperature limit is reached for the first time | |||
| No redundancy | 11 | 20 | 30 | 42 |
| Water circulation pumps working without time limit, no wood used | 22 | 34 | 46 | 60 |
| Stove burning time 4h per day without water circulation pumps | 13 | 27 | 46 | 62 |
| Stove burning time 8h per day without water circulation pumps | 23 | 38 | 72 | 109 |
| Water circulation with battery or portable power station (24h) + wood burning boiler | 46 | 58 | 70 | 84 |
| Stove burning time 16 hours per day | limits not reached as long as there is wood | |||
| Water circulation with battery + wood burning boiler + gasoline generator | limits not reached as long as there is gasoline and wood, one full tank lasts about 2 weeks with Biltema generator | |||
Cost comparison and discussion
In this case study, the studied house was built in 1946 after the war in Lapland. As in all old houses, the heating system was wood-based before electricity came to the area. Many old stoves were removed when electric heating was introduced, but there was a pre-existing chimney available, which enabled installing a new energy-efficient stove in 2019. In 1994, a heating system using water circulation and both electricity and wood as energy sources was built. The wood-fired boiler gives both heat to all rooms as well as hot water for showers and cooking. Additionally, the Kota stove enables cooking during power outages.
The results of this case study show that the resilience of the system during a power outage can be increased by adding a switch and a plug for giving power to the water pumps. A battery and an inverter or a portable power station with a switch provide approximately an additional day before the cooling begins. The cost of the system is estimated to be approximately 700 €. An additional investment to a 400 € gasoline generator increases the operating time of the heating system during a power outage to two weeks with a full fuel tank. If additional fuel is available during that time, the operating time increases accordingly.
These old houses can be resilient with very low investments, if the original wood heating is still operational. Even if the old system is removed, a new non-heat-storing stove costs approximately 1000€, if an existing chimney can be used. Heat-storing fireplaces can be more expensive. Utilization of wood heating is not affected by the power outage and is only limited by the availability of wood and the person to take care of the burning of the wood.
Conclusions
In this study, the energy resilience of residential buildings in the Arctic was studied computationally by considering an old, detached house as a case study. The studied scenario was a sudden power outage during wintertime cold spell in the Arctic area when the temperature was an average -35⁰C. The results are indicative, because a simplified model was used, and there was no exact indoor temperature data available for adjusting the parameters. However, the results show that a simple computational model can be used to evaluate the functioning of different auxiliary systems for heating. Approximate input data is available for all buildings that have an Energy Performance Certificate. So, the developed method can be easily used to study resilience of small buildings that have the certificate.
The advantage of the presented model is that it is relatively easy to use and needs only a limited amount of input parameters. Thus, it is suitable for comparing the resiliency of different heating systems and their auxiliary systems in the conceptual design phase. To get more detailed information, for example, on temperature distributions in different parts of the building, more sophisticated models or further development of the current model are needed.
The modelling results show that there are cost-effective ways to improve heating system resilience in old, detached houses in the Arctic conditions during power outages. The case study shows that resilience of a heating system with a wood-burning boiler can be cost-efficiently increased by applying an additional switch, a plug, and a small battery to run the water pump. Even more resilience can be achieved if the battery can be loaded, for example, by a generator.
In the future, the model can be developed further and utilized more broadly. The optimal solution to improve the energy resilience is dependent on the house in question and its existing heating systems. To get an overall understanding of the resilience of heating systems in the Arctic area, calculations should be carried out with broad range of different heating systems and houses.
References
Ayyagari, S., Gartman, M., Corvidae, J., 2020. A Framework for Considering Resilience in Building Envelope Design and Construction, Rocky Mountain Institute: Basalt, CO, USA 2020.
Biltema. (2026, October 12). Sähköaggregaatti G3000. Biltema. https://www.biltema.fi/tyokalut/aggregaatit/sahkoaggregaatti-g3000-2000043448
Einolander, J., Kiviaho, A., and Lahdelma, R., 2024. Power outages and bidirectional electric vehicle charging: Simulation of improved household energy resilience in subarctic conditions. Energy & Buildings, 309, (2024), 114055.
Horne, G. E., Seichter, S., & NATO Modelling and Simulation Group. (2014). Data farming in support of NATO (STO Technical Report TR-MSG-088). NATO Science and Technology Organization. https://doi.org/10.14339/STO-TR-MSG-088
Jasiūnas, J., Lund, P.D., and Mikkola, J., 2021. Energy system resilience – A review. Renewable and Sustainable Energy Reviews, 150, (2021), 111476.
Ministry of the Environment. (2017). Ympäristöministeriön asetus uuden rakennuksen energiatehokkuudesta (1048/2017). Finlex. https://www.finlex.fi/eli/sd/2017/1048
Octave Top (GNU Octave (version 11.1.0))
Pulkkinen, J., & Ramesh, R. (2026). Passive resilience solutions and their impact on a cold climate building during a power outage. Energy and Buildings, 366, Article 117628. https://doi.org/10.1016/j.enbuild.2026.117628
Rehman, H.u., Nik, V.M., Ramesh, R., and Hasan, A. 2025. Modeling the impact of diverse extreme climate scenarios on residential buildings with renewable energy and storage in cold regions: A techno-economic analysis. Proceedings of the 19th IBPSA Conference, Brisbane, Australia, Aug 24-27, 2025. https://doi.org/10.26868/25222708.2025.1109
Sheng, M., Reiner, M., Sun, K., Hong, T., 2023. Assessing thermal resilience of an assisted living facility during heat waves and cold snaps with power outages, Build. Environ. 230 (2023) 110001. https://doi.org/10.1016/j.buildenv.2023.110001.
Verkkokauppa.com. (2026, October 12). DJI Power 1000 V2 virta-asema 1024 Wh. Verkkokauppa.com. https://www.verkkokauppa.com/fi/product/999574/DJI-Power-1000-V2-virta-asema-1024-Wh